USING AI TO SOLVE LIFE’S PROBLEMS: POWERED BY DATAROBOT & SNOWFLAKE

Time Series forecasting—using statistics and modeling to make predictions based on historically timestamped data—is a vital process for a wide range of industries. Most commonly used for economic predictions, climate forecasting, or commodities trading like futures on oil prices, time series forecasting is invaluable when it comes to informing strategic decision making.
In the past, creating these forecasts typically required entire teams of statisticians and data scientists, data lakes, and sizeable corporate budgets. However, with the advent of some modern tools like DataRobot, Snowflake, and AWS, time series forecasting, linear regressions, and other data-driven prediction methods are within reach for a larger pool of data analysts and engineers. While time series forecasting is generally thought of as a way to predict market fluctuations or long-term weather trends, these tools have also given us the ability to leverage the process to improve everyday life.
Data in the Day-to-Day
As anyone who works in a major metropolitan area knows, the commute to the office requires tedious planning. Whether you’re pacing out when to leave based on the morning traffic, finding the last possible train you can catch without being late, or checking the temperature to determine whether you’ll be a sweaty mess after riding your bike, it’s something we’ve all dealt with at some point. After years of being at the mercy of public transit schedules, I finally realized that it would be faster to bike to work than wait for a train—not to mention the fact that seeing the city on a bicycle is more enjoyable than being stuck in the subway.
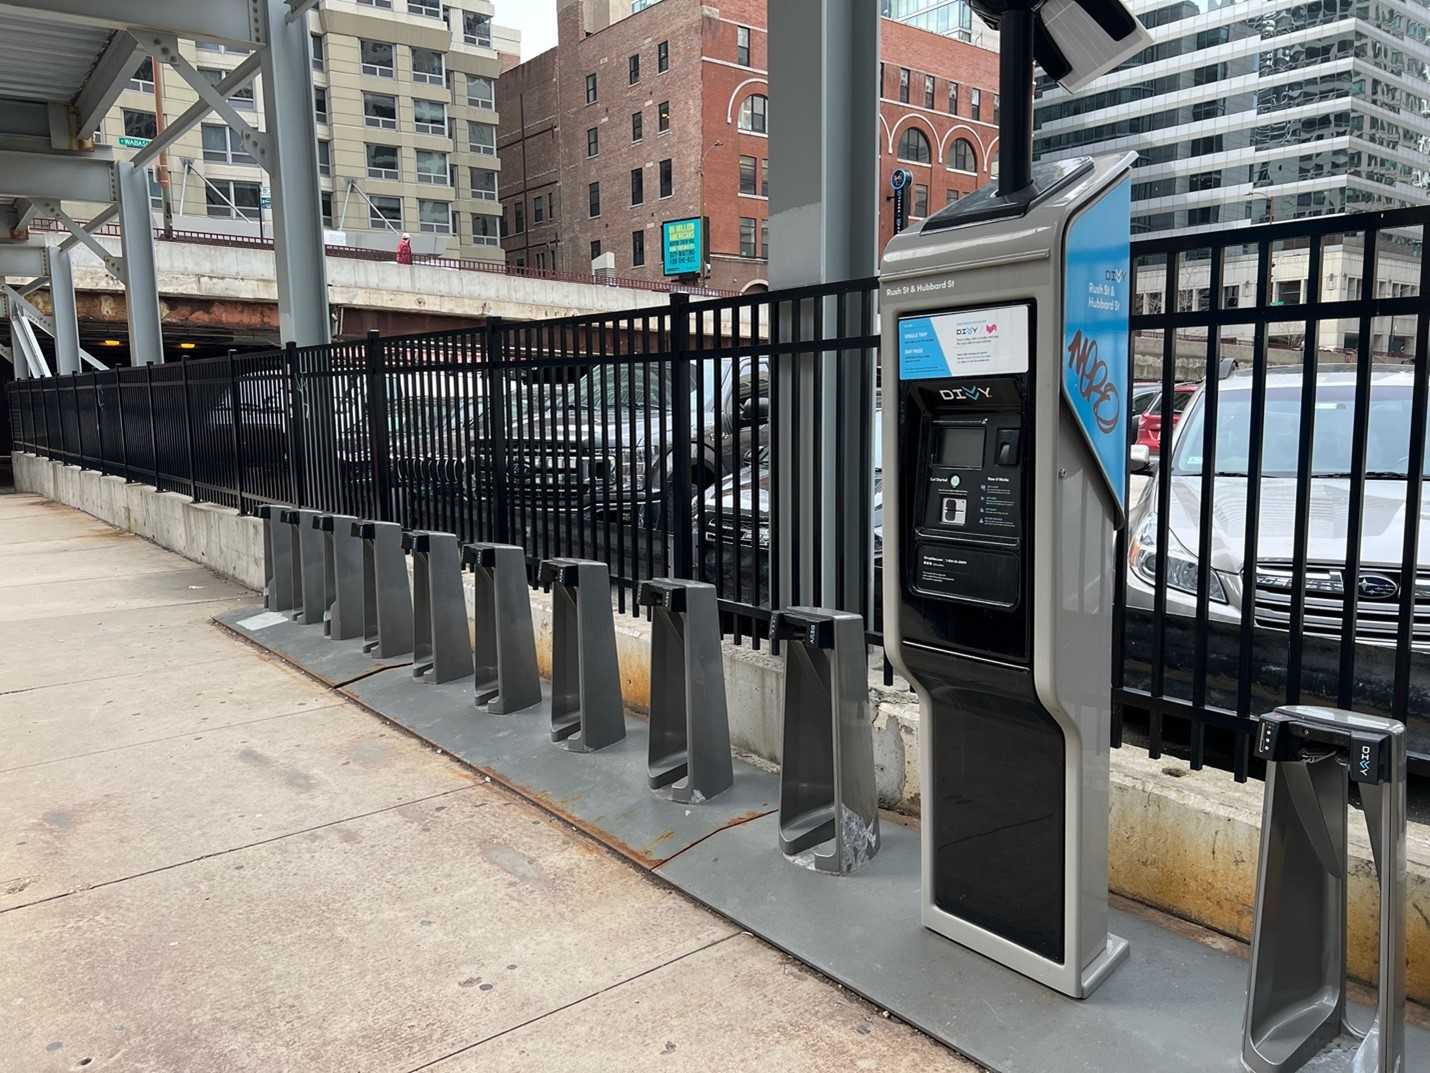
However, I ran into a problem when it came to e-bike availability. While some days I could snag a bike with no issue, others would leave me scrambling (and late) because the e-bike terminal was completely empty.

Using the Divvy app, I could see if and/or how many e-bikes were available at the current time, but if I want to know what availability will look like in the future (like in the morning after I roll out of bed and get ready for work), I found myself playing a risky game of e-bike roulette. Since I knew there was an API provided by Divvy for a point-in-time snapshot (now), I determined that I could input the historical time series data into DataRobot to forecast the future point (probability of an e-bike being available). All I needed to do was save the data and do some data wrangling to format it in a way DataRobot finds usable.
Technical Background
Divvy makes ride data available to the public, but nothing on the actual availability of the bikes. However, they have an open API that shows every station and the number of e-bikes, open docks, and disabled docks across the city.
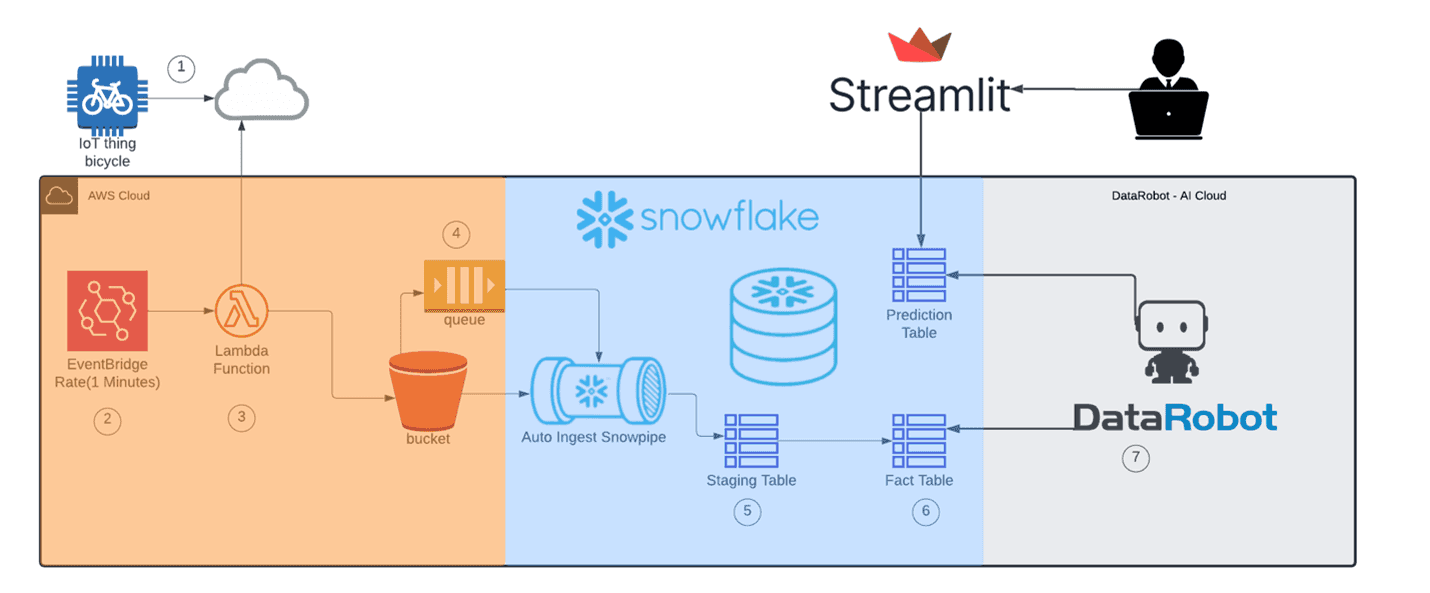
I decided to start saving the station availability data in S3, a common raw storage area for data lakes and a very low-cost option that can scale to any size. The goal was to create a reliable forecasting model to predict availability with S3 as the traditional raw layer of my data model. Next, we have the staging layer. I chose Snowflake for its integrations that allow the auto-ingestion of data from S3 and connectors from DataRobot to read the historical data and write out the predictions.
Snowflake is completely scalable and decouples storage from compute, so you only pay for the storage and/or compute you use. The staging layer is where I can place the semi-structured data and wrangle it into the proper form to be leveraged by my AutoML platform, DataRobot. DataRobot was the obvious choice here due to its ease of use, time series support, SaaS environment for training and deployment, and integration with Snowflake.
Using AWS’ Serverless Application Model (SAM), I was able to code a simple Lambda function to scrape the API and store the data in JSON format within S3. From there, the data is auto-ingested via Snowpipe to a raw variant type in Snowflake. Next, a scheduled task performs the ETL to extract the values out of the JSON format and insert them into the fact table as traditional structured data.

Once I had the fact data I needed to predict the target variable, I would look for “e-bikes available > 1,” which was a calculated column in Snowflake as part of the ELT process. This became the target variable: ebikes_available_bool (a Boolean model of true or false values).
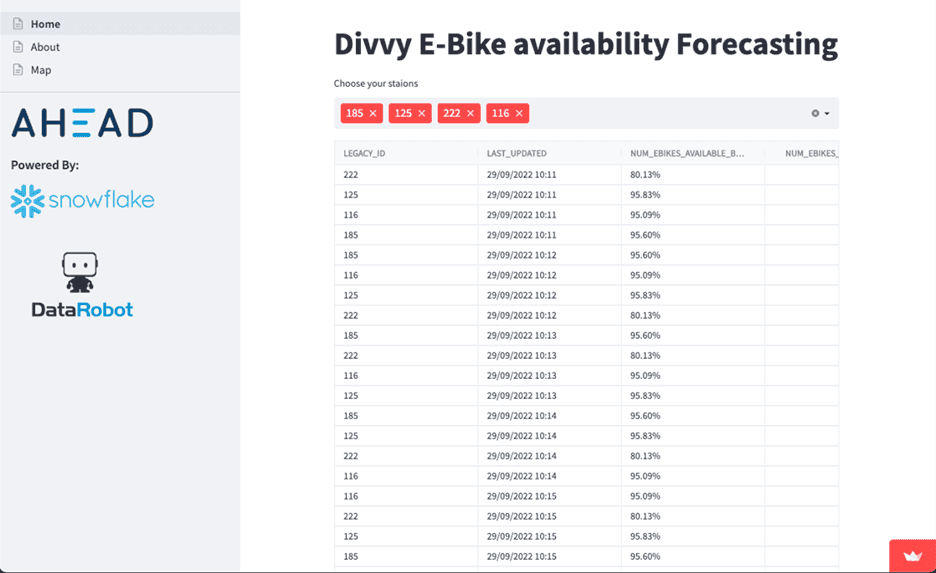
Finally, I needed a way to display the DataRobot inferences in a functional user interface. This is where Streamlit comes in. Streamlit is an easy-to-use PaaS solution for hosting data-driven applications where you can develop your UI in Python (and often in common data engineering language) that is fully hosted by Streamlit and automatically deploys from git hooks in your repo.

Try It Out
If you’re in the Chicago Metro area and want to try it out for yourself, check out the site here. Additionally, feel free to fork my code – the time series Divvy dataset is available on the Snowflake Marketplace free of charge for anyone’s use.
To learn more about how AHEAD can help your organization leverage the advanced data capabilities of Snowflake and DataRobot, get in touch with us today.
